I still remember the first time I read an email, it was on a black and white monitor in my Gmail, the computer was provided to my father through his office somewhere around 2006-07. It was a fascinating thing then as it is now, earlier in those days receiving messages and very small files mere some KB’s through the electronic medium was a miracle. It just fills me with joy with the way emails have evolved and how it has transitioned into a full-scale marketing strategy.
Although there have been talks about email being dead and questions been asked about its future. I feel very positive about it. Today I will present to you some mind-boggling email marketing statistics that prove my claim. I will analyze the data by more than 10 email marketing companies to show you the relevance of email marketing in 2022.
In this article, I will analyze the following email marketing statistics –
- Subject Line & Open Rates Statistics
- Email CRT or Click Through Rate Statistics
- Email Marketing ROI Statistics
- Email Marketing Statistics on Mobile
- Email Spam Stats
- Email Engagement Statistics
- B2C Email Marketing Statistics
- B2B Email Marketing Statistics
- Email Segmentation Stats
- Customer Service Email Statistics
Subject Line & Open Rates Statistics
What is an Open rate? – Open rate refers to the percentage of emails opened from the total number of emails sent in a campaign.
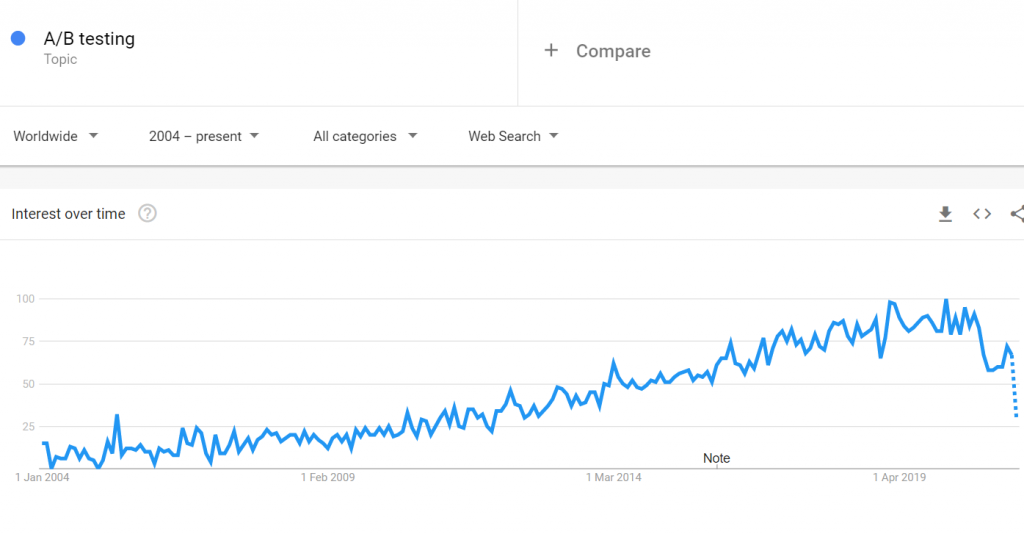
You must have noticed that most of the email services companies give you a feature of A/B testing and subject line testing is the most primary feature that it allows. These companies have a huge amount of data that clearly shows a relation between the Subject Line and Open Rates and hence the conversion. It can also be clearly seen the importance of A/B testing (Not limited to email marketing but all the marketing channels) is increasing with time, due to the simple fact “It increases your conversions”
Let’s look at some Open rates & Subject line stats from various industry players –
Average Open Rates –
- “The average email open rate is 25.85%” – SendinBlue
- “All Industries – Overall Average Open Rates is 33.41%” – Constant Contact
- “Average open rates can vary based on industry and the types of emails sent. For a standard email marketing campaign, a good open rate benchmark is 20%-25%” – Active Campaign
- “Overall Average Open rate is around 22.15 to 22.02%” – GetResponse
- Small business average open rates between 11% and 50%. – Aweber
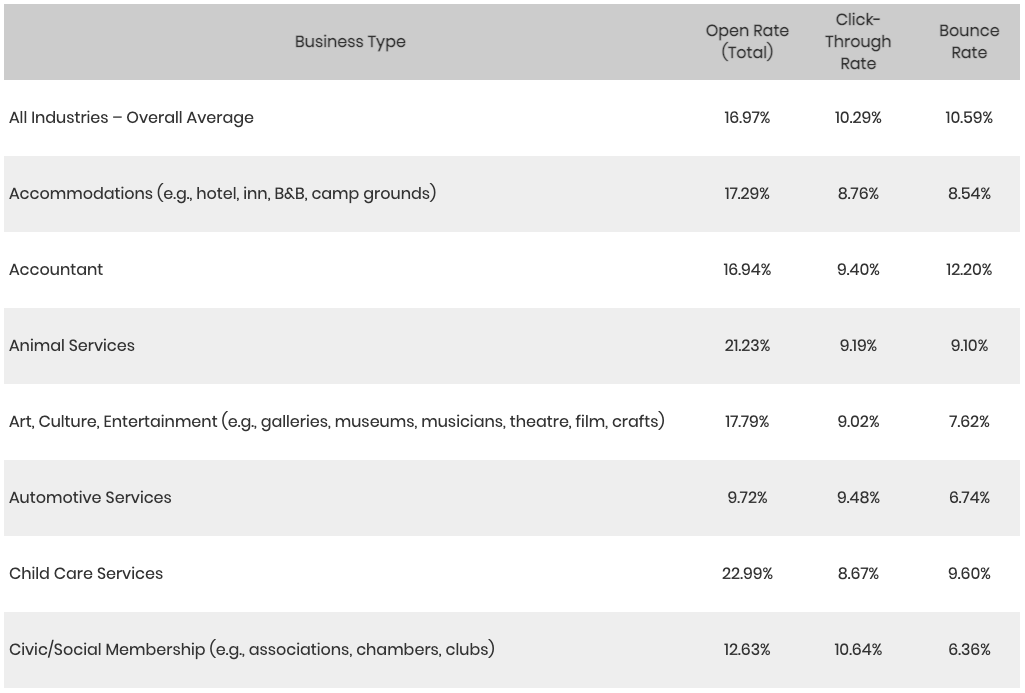
Average open rates according to industry –
Relation between subject line and open rates –
- A study by Experian found that email subject lines with an emoji increased open rates by 56%, as compared to text-only subject lines – GetResponse
- Emails with personalized subject lines get a 26% boost in open rates – Campaign Monitor
- 47% of email recipients will open your email based solely on the subject line – OptinMonster
- The words “free”, “help”, “percent off”, and “reminder” in a subject line have been found to negatively impact open rates – Unbounce
- Emails related to Hobbies, Government, and Arts/Artists have the highest open rates – Mailchimp
CHECK OUT HOW TO USE THE BEST FREE SMTP RELAY SERVICES TO SEND FREE EMAILS, AND IF YOU HAVE NO IDEA ABOT SMTP SERVERS THEN READ OUR GUIDE ON WHAT IS AN SMTP SERVER?
Email CTR or Click Through Rate Statistics
What is a Click Through Rate? – CTR or click-through rate refers to the percentage of emails clicked from the total number of emails opened in a campaign.
Almost all the companies provide you with the CTR stats in their reports. It is one of the most basic features that any email marketing tool provides. It is imperative to calculate the email’s ROI. There is no point if someone opens your emails and does not click? What’s use does an email campaign have, if it does not lead to any conversions?

Here are some of the most amazing Click through rate stats that you should keep in mind while planning your campaign –
- Including videos in your email can increase clickthrough rates by up to 300% – Martech Advisor
- 78% of marketers have seen an increase in engagements (including click-throughs) in the last 12 months – HubSpot
- We’ve found that including a video in your email can improve click rates by 65%. – CampaignMonitor
- Including social sharing buttons in your emails can increase CTR by 158% – Disruptive Advertising
- I have seen this with experience that including Images, GIF’s and Videos increase your CTR and Engagement rates by 150% – Aabhas Vijay, Founder, www.SMTPServers.co
Email Marketing ROI Statistics
You must have heard that email marketing delivers the maximum ROI which can be up to $38-42 for every $1 you have to spend. It sure is one of the most profitable marketing channels. I am not just saying it because I love email marketing, Ok I am a little biased too but there is significant data available to back this claim.

Check out these data-backed email marketing statistics –
- 73% of marketers rated the ROI of email to be “Good” or “Excellent” – SaleCycle
- Email Marketing ROI delivers a steady return of $30-40 for every $1 you spend, depending on your sending volume, industry, and ESP – Aabhas Vijay, Email Marketer – SMTPServers.co
- An individual email address is worth almost $50 to companies – DMA
- Shoppers spend 138% more when marketed to through email, as compared to those who do not receive email offers – Disruptive Advertising
Email Marketing Statistics on Mobile
It’s evident that people have started using mobile phones for online searching, shopping, checking emails, etc. Which has been reiterated by many marketers, google summits, etc. So it’s only imperative to look at the recent trends in email marketing for Mobile.

Let’s explore some statistics on email marketing on mobile –
- Mobile devices account for 41.9% of all opened emails – Litmus
- Gmail was the leading email client as of April 2019, with 27.8% of users viewing emails through it. The iPhone client was second with 27.6% – Litmus
- According to Google, 75% of Gmail users use their mobile device to access their accounts – Tech Crunch
- 1 out of every 3 clicks in an email is registered on a mobile device – Campaign Monitor
- 23% of consumers who open an email on a mobile device will open that email again later – Campaign Monitor
Email Spam Stats
There’s no point if your email campaign goes down the spam, you have invested your time, energy, resources, and most important money on the campaigns. And I say with experience there is nothing more frustrating for an email marketer to see his/her beloved email going in the spam. Let’s explore some of the reasons and how to decrease spam using the learning from other marketers. Remember to use an SMTP Server to get optimum email marketing results. Also, feel free to check out the blog on Free SMTP Server and how to use them in your WordPress website to send free emails. 
Check out these email spam stats –
- 69% of email recipients can use the subject line to tell if it is spam – OptinMonster
- Only sending emails to subscribers who have opened or clicked one of your emails in the last 6 months will help you decrease the number of emails that end up in the spam folder – Linkedin
- 45% of all emails sent are considered spam – SpamLaws
- For every 12.5 million spam emails sent, 1 will get a response – TechRadar
- 14.5 billion spam emails are sent every day – Spam Laws
Email Engagement Statistics
Email Engagement is referred to as a metric that determines how well your recipients have interacted with your emails. It comprises your open rate, click rate & conversion rate.
Let’s check out some email engagement statistics –
- The top 3 reasons people choose to unsubscribe from an email list: too many emails (59%), info no longer relevant (43%), or don’t recognize the brand or remember signing up (43%) – OptinMonster
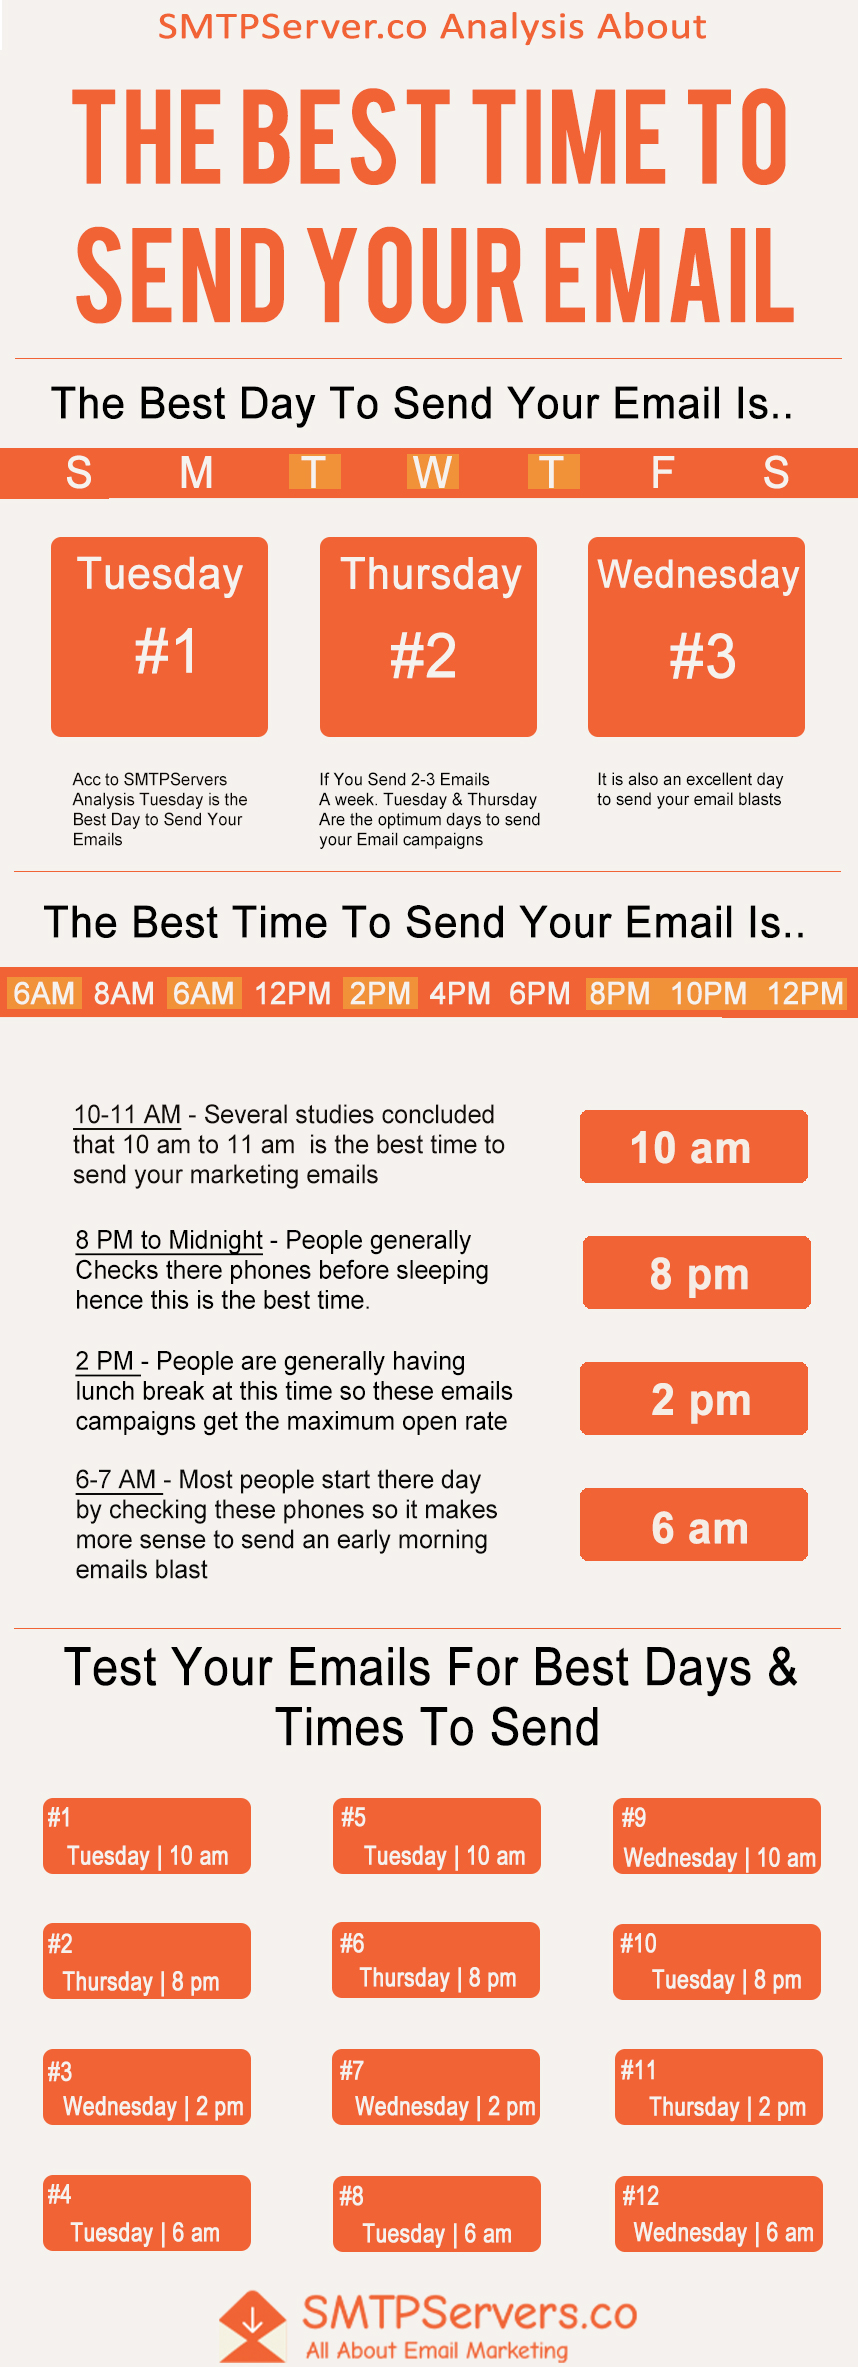
- Tuesday is the best day to send the emails followed by Thursday – SMTPServers.co
- QuickSprout found that email subscribers are 3.9x more likely to share your content on social media – QuickSprout
-
Email marketing is the most effective way of nurturing leads. 31% of businesses cite newsletters as their highest-performing tactic in this area – Content Marketing Institute
B2C Email Marketing Statistics
Being in the B2C industry for almost 3 years, I can say this with confidence Email marketing works wonders. These stats are curated especially for the Service sector, eCommerce, Re-Commerce, and all the other businesses that directly deal with consumers.
Let’s check out some of the amazing B2C stats that you need to keep in mind when you plan your email campaign –
- Sending 3 abandon cart emails yields 69% more orders than 1 email abandon cart campaigns – Omnisend
- Open rates for cart abandonment emails come in at 40.14% – Salecycle
- 59% of consumers say emails affect their purchase decisions – Salecycle
- Shopping cart abandonment emails sent 1 hour after the user leaves your site are the most effective, converting 6.33% of shoppers – Convince & Convert
B2B Email Marketing Statistics
B2B marketing is very different from B2C marketing. The target group has a very different thought process and search habits. This is in fact true in the email marketing domain as well. The complete email marketing series differs in its purpose, design, and timings.
Check out these stats and you can compare them with the B2C stats yourself –
- B2B marketing emails see a 23% higher click-to-open ratio than B2C emails – Emfluence
- 59% of B2B marketers cite email as their top channel for revenue generation – Emma
- Email newsletters are the most-used type of content marketing for 81% of B2B marketers – Content Marketing Institute
- Nine out of ten B2B companies use email engagement as a content performance measure. That makes it the most popular metric – Content Marketing Institute

Email Segmentation Stats
Most (I would say 90%) of the marketers rely on segmentation, tagging, and automation to make the most out of their campaigns. Providing the right information through segmentation at right time to your clients drastically increases your chances of conversions. It increases your engagement and fewer unsubscribes.
Let’s look at eye-opening Email Segmentation Stats you must know –
- Emails with personalized subject lines are 26% more likely to be opened – Campaign Monitor
- Trigger-based emails perform 3x better than nurture and batch emails – Imagination
- Email personalization produces 6x higher revenue and transaction rates – Experian
- Segmented email marketing campaigns can lead to revenue increases of as much as 760% – Campaign Monitor
Customer Service Email Statistics
Customer and Businesses have a very unique relationship, The relationship is almost analogical that with your wife in the sense that your customers always need more than you are willing to chug out. 😀
Let’s look at eye-opening Email Customer Service Stats you must keep in mind while designing your campaigns –
- 71% of consumers (age 16 – 24) believe that a quick response from your service team can drastically improve their customer experience. – Comm100
- 90% of customers rate an “immediate” response as important or very important when they have a customer service question. 60% of customers define “immediate” as 10 minutes or less. – HubSpot Research
- Nearly 70% of customers are irritated when their call is transferred from department to department. – Zendesk
- Your online conversion rate can improve by roughly 8% when you include personalized consumer experiences. – Trust Pilot
- 70% of the customer’s journey is based on how the customer feels they are being treated – McKinsey
General FAQ
What is the success rate of email marketing?
Having been in the email marketing industry for many years & analyzed email campaign success statistics from many email players, I can definitely say that your success widely depends on 3 broad factors –
- Your list size, segmentation, and how you have gained the email addresses
- Timing of your emails
- Email Marketing Service Provider
If you have everything in place then I would say you can easily make around 10-15x on your email marketing efforts.
What is the average ROI for email marketing?
Here is the truth about the ROI of email marketing according to my experience-
- Beginning (Negative) – You are starting out, doing everything yourself, testing email marketing services, and experimenting, you will lose money and it’s Ok too everyone does, but analyzing what went haywire is the key to success
- Intermediatory (2-3x) – You have made mistakes and explored the features of your email service provider. You now know how to calculate the email marketing ROI and your list is steadily growing. You can easily pull of 200 to 300% return on your investment.
- Advanced (20-40x) – You know your statistics and what works with your clients, you have segmented lists and have reached economies of scale, the ROI on email marketing can be as huge as 20000 – 40000%.
What is the average Open & Click rate in email marketing?
Read the complete email marketing stats on my blog, here is just a glimpse from the data I have analysed –
- “The average email open rate is 25.85%” – SendinBlue
- “All Industries – Overall Average Open Rates is 17.13%” – Constant Contact
- “Average open rates can vary based on industry and the types of emails sent. For a standard email marketing campaign, a good open rate benchmark is 20%” – Active Campaign
- “Overall Average Open rate is around 22.02%” – GetResponse
- Small business average open rates between 11% and 50%. – Aweber
Is email marketing growing?
As far as you check our emails daily and use them to communicate, it is growing steadily. Here are some email statistics to prove my point.
Pingback: How To Find Someone's Email Address - www.SMTPServers.co
Pingback: 14 Spring Newsletter Ideas & Subject Lines (with Examples)
Great article, thank you! I’d like to point your attention to a broken link to one of the sources (about trigger emails stats). Probably you would like to replace it with a new one. I found this post https://rampiq.agency/blog/b2b-email-marketing-in-2022-what-you-need-to-know-to-succeed/ on email marketing rather informative as well
Awesome and interesting article. Great things you’ve always shared with us. Thanks. Just continue composing this kind of post.